>
>
>
Gantt chart: Work collaboratively and stay in control of project organization
Gantt chart: Work collaboratively and stay in control of project organization
Published on

Designed by a Polish engineer, the Gantt chart was first used in 1896 by Karol Adamiecki when he wanted to plan his research. 14 years later, an American management consultant named Henry Gantt gave this tool the official name we know today: Gantt chart. Used mainly in project management, it is represented as a table containing all the data needed for the proper execution of team members' assignments. What are the advantages of adopting it? How can it be built and used effectively? We have organized our ideas to answer these questions.
————
What is a Gantt chart?
Centralization of tasks
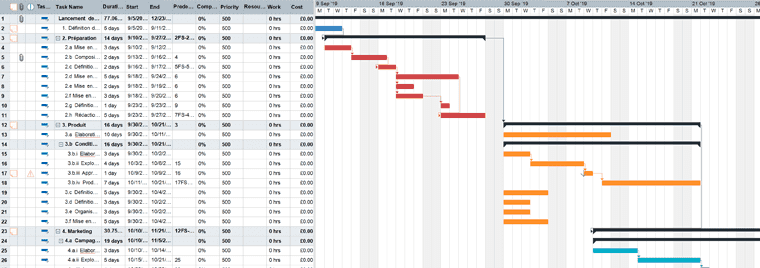
It is an effective tool for better managing a project, that is, a variety of actions. Concretely, a Gantt chart gives its users an overview of their tasks to be completed over a given period (most often spread over one year). Each one, represented by a horizontal bar, indicates when team members commit to completing it, in other words its start date and deadline.
You will find time units on the horizontal axis (hours, half-days, days, weeks, months, quarters, years) and tasks to be completed on the vertical axis. For some users, it may be relevant to work in half-days, while for others, monthly tracking may be more suitable. Depending on their role within the team, their expertise, and the management style adopted, the time unit may differ. Ultimately, team members who are used to being autonomous are given greater freedom in their schedule.
A collaborative tool
This method, which is most often collaborative, allows both personal organization and visibility into how assignments are distributed among team members. With this chart, all completed, ongoing, and pending tasks are shown in a single space. Group members can therefore know precisely what they have to do, as well as the topics already handled / being handled / soon to be handled by each person.
Using the Gantt chart for project management
Using a Gantt chart offers several advantages, both organizationally and in terms of communication.
Highly precise organization based on forecasting
Let us focus on the initial function of this chart: the ability to organize better. With this table, users can, on the one hand, know exactly what actions they need to carry out, and on the other hand understand that each one is necessary for the successful conduct of the project.
This tool is also useful for estimating the duration required for each task or at least practicing setting a completion time. Admittedly, there may be approximations and the planned time may turn out to be too short or too long. However, the challenge is to get as close as possible to the actual duration of the assignment and therefore ensure deadlines are met. According to Parkinson's law, completing an activity depends on its deadline. For example, if you have to send a file to city hall before November 31 for a planned trip, you will send it before that date (or at least do everything to do so). But if you simply tell yourself that the file must be sent to city hall as soon as possible (with no deadline), and you do not have the trip constraint, the risk of procrastination will suddenly increase. Indeed, the lack of a final deadline and unclear instructions are likely to lead you to postpone the action.
Moreover, thanks to the overall view it provides, choosing the sequence of tasks becomes easier. Thanks to the way horizontal blocks work (also called milestones), a reader of this chart will know when several assignments will be carried out at the same time and which ones will come after those currently underway. The aim is therefore to carry out assignments in a logical order. Imagine you need to share a sales brochure with your hot prospects: several actions must be completed beforehand and in a specific order. Before designing the brochure, you will need to do research for writing, write the content, proofread it, get the text approved by your supervisors, create a creative brief, and send it to the designers. Following this order will be necessary to achieve the objective (here, sharing the sales brochure with leads).
Transparent communication between team members
Beyond organizational support, the Gantt chart is a real aid for communicating with your team members and thus preventing everyone from moving forward alone. During information meetings, steering committees, and reviews, this table can serve as a reference point, reminder, and monitoring tool.
It is also a way to justify strategic decisions. If you noticed in a previous retrospective schedule that editing a past video took one week, you might choose to repeat that production time for your next event.
Another observation: your colleague Marine completed her assigned tasks before the proposed deadline, while her colleague Mathieu completed his one to two weeks late. You could decide to adjust task durations according to their performance, or even use these observations as arguments during their annual reviews.
It is therefore important to assign each listed task to one or more individuals. To be even more precise, you can also adopt the so-called RACI method: a matrix that distributes each team member's roles according to their relationship with the task. Four statuses are possible: the "responsible" who carries out the task, the "accountable" who approves it, the "consulted" who is consulted during its execution, and the "informed" who is informed of the mission's completion.
How to manage a project with the Gantt chart?
Determine the tasks to be completed
In a group project, it is first preferable to start with the tasks that initially come to mind, notably beginning with verbs in the infinitive: "Define a strategy applicable to everyone," "Distribute a video," "Share the goodies," etc. By arranging them chronologically, designing, reading, and tracking the table will be easier.
It is then up to you to break down the main defined tasks, so as to highlight the different assignments that compose them. Keep in mind that precision is key in building a schedule. Thus, the more precise it is, the easier it will be for the team member in charge of the action, as well as for the decision-maker, the consulted person, and the person who needs to be informed, to move in the right direction. Also note that each assignment should end with deliverables such as a client appointment booking, a written report, a finalized plan, etc. Once these deliverables are completed, the next assignment can begin.
Now let us assume that one of your key assignments concerns selecting a service provider for video editing: ask yourself about the associated sub-steps. Writing only "select a service provider for video editing" will not provide enough guidance for an employee about to carry out this assignment for the first time. Likewise, it will not allow a teammate to know the progress status of the provider selection. Is the collaborator at the beginning or the end of the assignment? The teammate will not be able to find the answer in the table and will spend time getting the answer verbally. Yet the presence of sub-steps would have saved them time.
Estimate task duration
Once the tasks to be completed have been determined, the creators of a reverse schedule, who may be multiple, must estimate the time they consider necessary to complete each listed task. This therefore means that a start and end date must be defined. Some assignments may be very short (between 2 and 6 days), while others may span several weeks or even months. To organize your assignments, one solution is to rely on the project's final deadline and start by thinking about your last assignment, then work backward toward the first. Which one is done at D-1? at D-3? at D-7? at D-10? at M-2? ...
However, this does not mean setting an execution time without prior thought. Without experience on an assignment or knowledge of the subject, the estimate may be far from reality and turn out longer than what is indicated in the schedule. Yet a task taking more time than planned will impact the following ones because most are interconnected. Consequently, in this situation it is preferable to seek information from people who are experts on the subject. Based on what they can confirm, you will be better able to set an accurate duration and deliverable for each of your assignments. Then, as you gain experience over time, you will get closer to the true execution duration.
Another tip to optimize schedule management is planning additional time buffers, i.e., a margin to use if needed. To do this, either you note the deliverable and leave several days to weeks with no ongoing assignments. The empty space can then be used if the initially allocated time was too short. Or you directly include in your task execution estimate a 5 to 10% time margin and identify it with a color code.
Finally, note that to save time, software tools exist (in Excel, Libre Project, etc.). By entering, for example, your assignment titles, their duration, and their end date, the tool will automatically calculate the project's start date, thus helping you reduce errors.
Update the table
Let us not forget that the Gantt chart is temporary. Thus, at any moment, you can choose to adjust the duration of a task based on your observations, but also change workload and material and human resources.
The table remains a way to track the progress of each assignment. Are they completed at 0%, 50%, 75%, 100%? Defining measurable objectives and being precise in assignment expectations will enable monitoring as finely as possible.
Monitoring assignment progress also requires tracking your team members' motivation. Are they just as enthusiastic at the beginning, middle, or end of the project? It is the manager's role to identify potential drops in interest in the project, difficulties encountered, and thus think about the actions to take to maintain constant and high satisfaction throughout the project.